Gain comprehensive insight into every aspect of your work process, from the organizational and departmental levels down to individual employees!
The shiftplan.io application provides you with tools to conduct a comprehensive analysis of completed work, absences, salary supplements, and other aspects of the work process. In just a few clicks, you can generate summaries and time trends for departments and employees across any time period. Curious about the number of overtime hours worked each month in the past year? The number of calculated salary supplements? The percentage of employees on sick or annual leave? No problem! The data is readily available to you, for any time period - even going back several years!
The shiftplan.io application provides you with tools to conduct a comprehensive analysis of completed work, absences, salary supplements, and other aspects of the work process. In just a few clicks, you can generate summaries and time trends for departments and employees across any time period. Curious about the number of overtime hours worked each month in the past year? The number of calculated salary supplements? The percentage of employees on sick or annual leave? No problem! The data is readily available to you, for any time period - even going back several years!
The summary display tools can be found under the Analysis section. In the side menu, select the team, data type to display (shifts, schedules, places, absences, supplements, and other statistics categories), the time period, and the data aggregation method. You can display data for the entire time period or aggregate it by day, week, month, or year. The latter is particularly useful if you are interested in time trends for specific aspects of the work process (e.g., how the percentage of sick or annual leave changes by month). From the tool bar, you can choose how to display the data - in a table or graph format. You can also select the values to be displayed in the table or graph: total duration, number of repetitions, duration as a percentage compared to the total duration of all shifts and absences or duration as a percentage within the selected categories.
In tabular format, data can also be easily copied to any data processing program (e.g. Excel), which allows for easy further analysis of the data. A customized summary display is also available within Razpored, which allows for a quick overview of key information during the creation and editing of work schedules.
Below are some typical examples of using summaries, which also demonstrate the range of functionalities for analysis in the shiftplan.io application.
Display of time trends for absences
Are you interested in which months have the most employees on sick leave? When do most employees take their annual leave? What percentage of all calculated hours represents annual leave in previous years? Answers to these questions can help you make personnel decisions and plan work processes for the future, and can also quickly show potential problems within individual departments (e.g. a persistent increase in the percentage of sick leave in a particular department may indicate employee overload or poor relationships within the team).
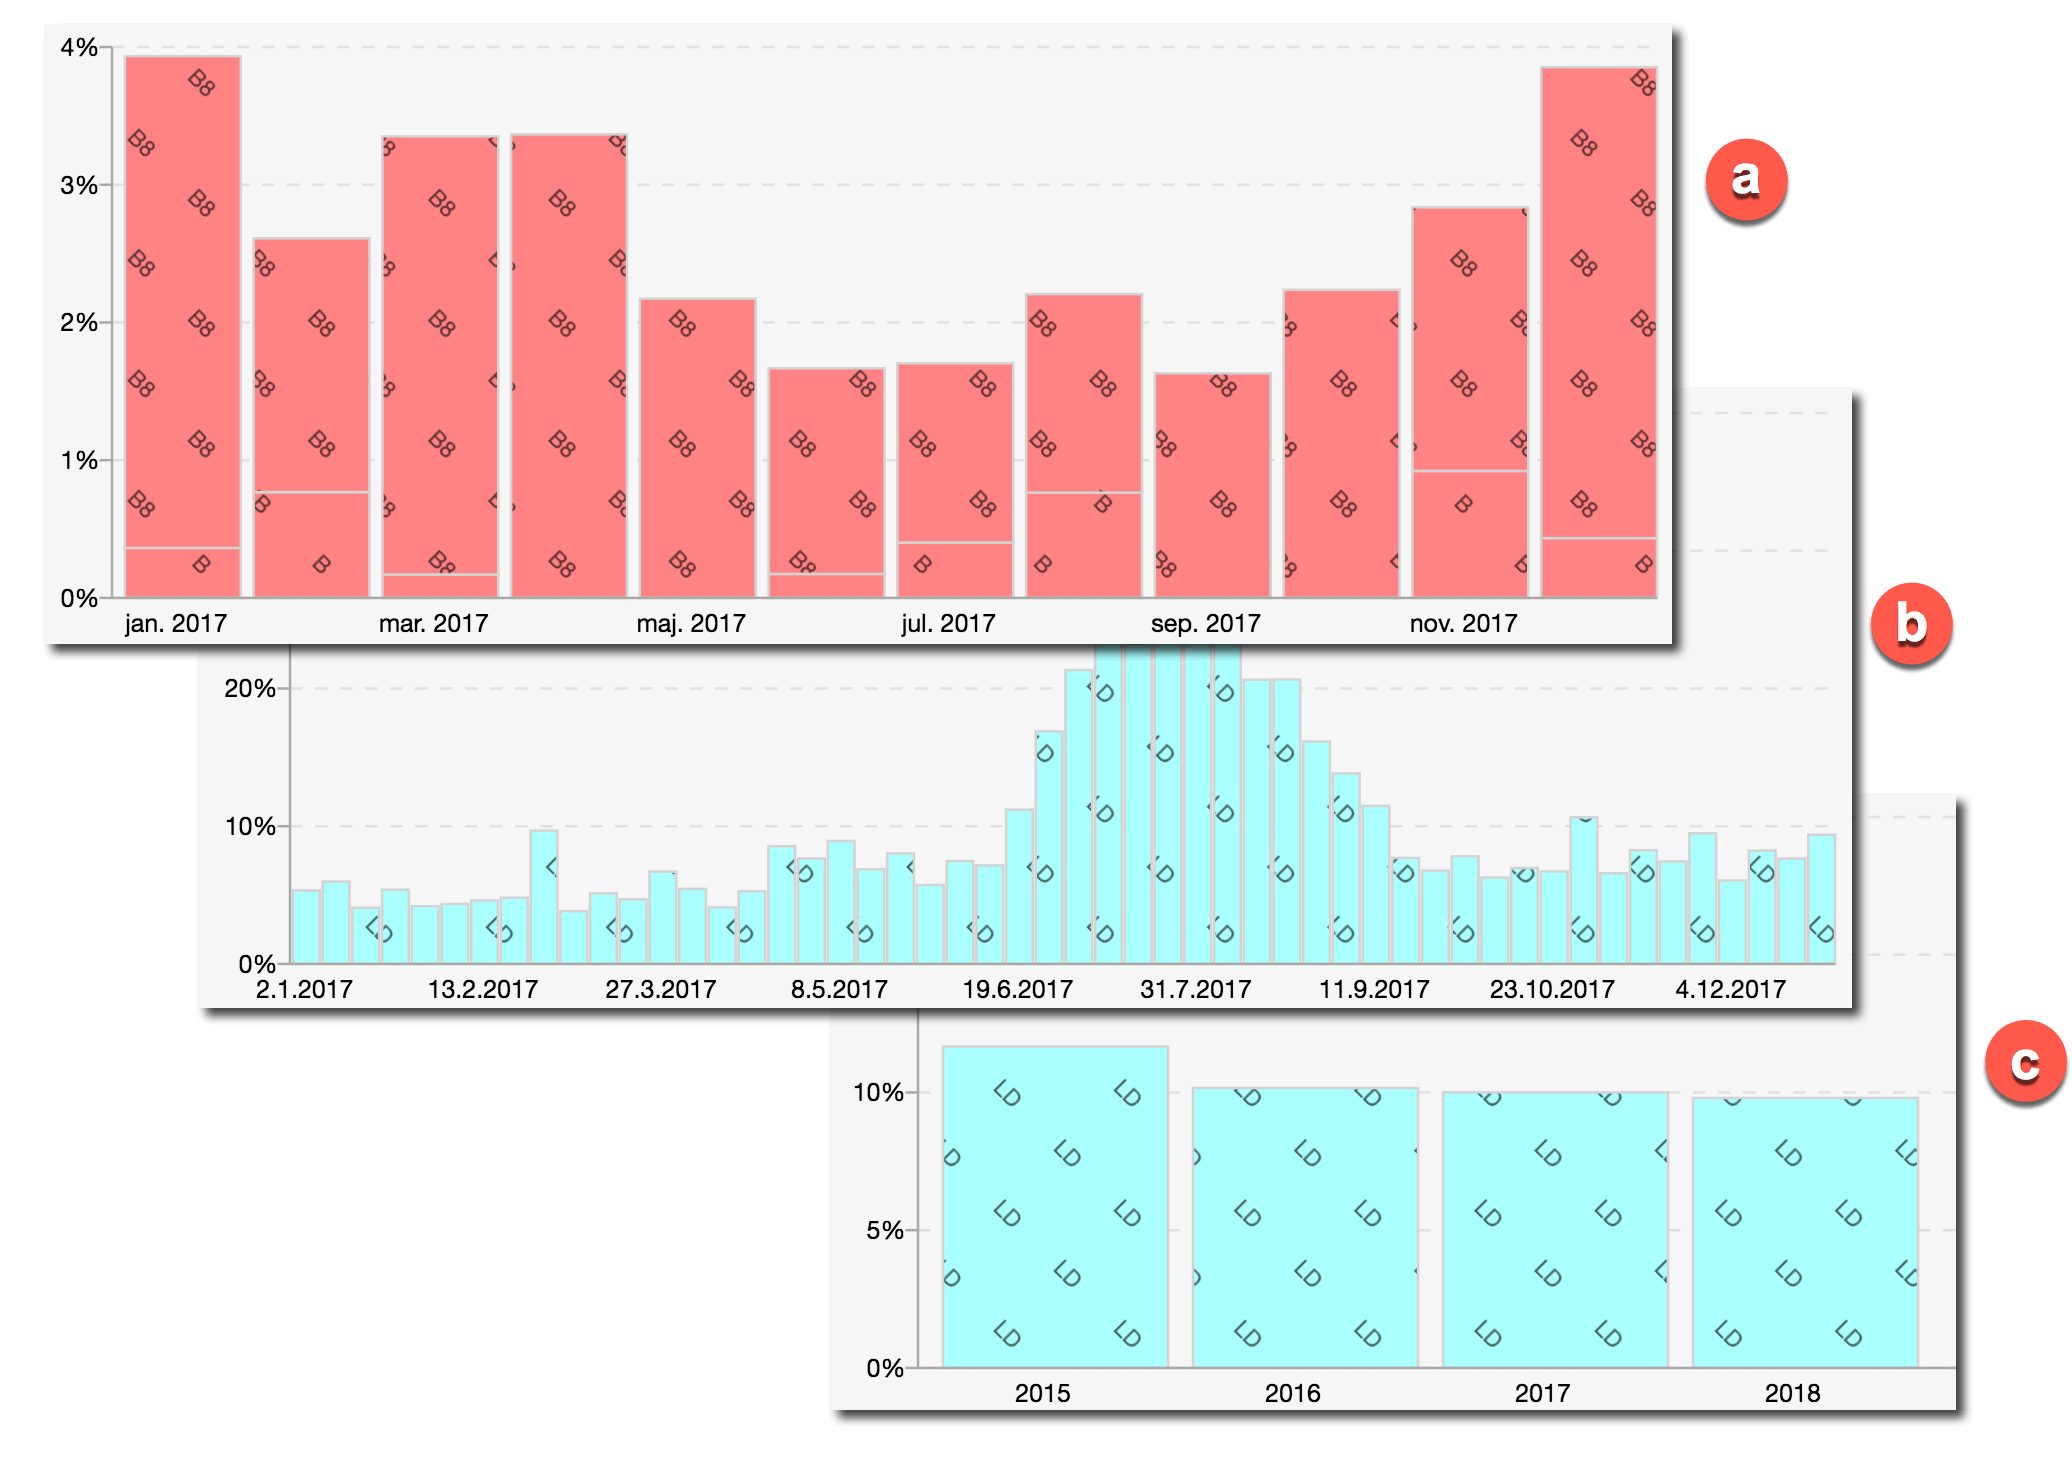
Time trends of individual absences for the entire organization. a Percentage of sick leave compared to total workload of employees by months in the year. b Percentage of annual leave by weeks in the year. c Percentage of annual leave by years for the last few years.
Percentages of completed shifts
Certain schedules and workplaces differ from each other, both in terms of their complexity and popularity among employees. However, in order for work to run smoothly, all shifts must be properly staffed.
In the summary display, you can easily check what percentage of working hours have been completed for a certain schedule or workplace, both at the level of entire departments and comparatively among individual employees within the department. This way, you can ensure that employee workloads are balanced.
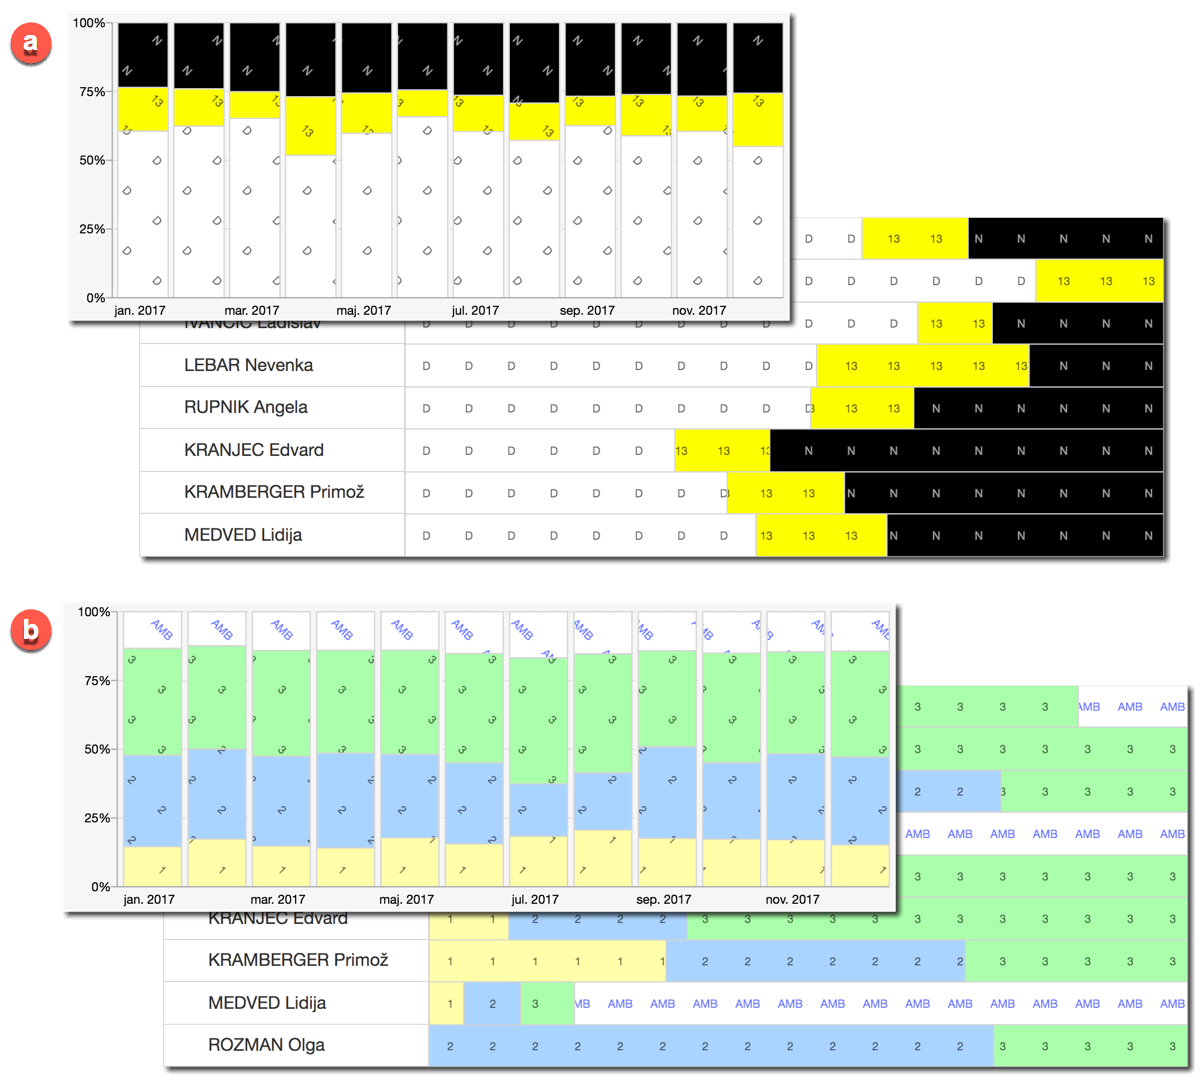
Shares of worked shifts per month and for the entire period. a Shares of worked schedules for the entire department and comparison by individual employees. b Shares of completed hours at different work sites for the entire department and comparison by individual employees.
Calculated salary supplements
Various salary supplements have a significant impact on labor costs and are also an indicator of possible problems in the work process. For example, if the total amount of paid supplements for uninterrupted working hours consistently increases from month to month, it may be a sign that a particular department is understaffed, as employees cannot fulfill all work tasks within regular working hours.
You can also review summaries of salary supplements for future periods as soon as you have a draft work schedule - before it is available to employees. This way, you can adjust the schedule accordingly and avoid any unnecessary costs due to an suboptimal schedule.
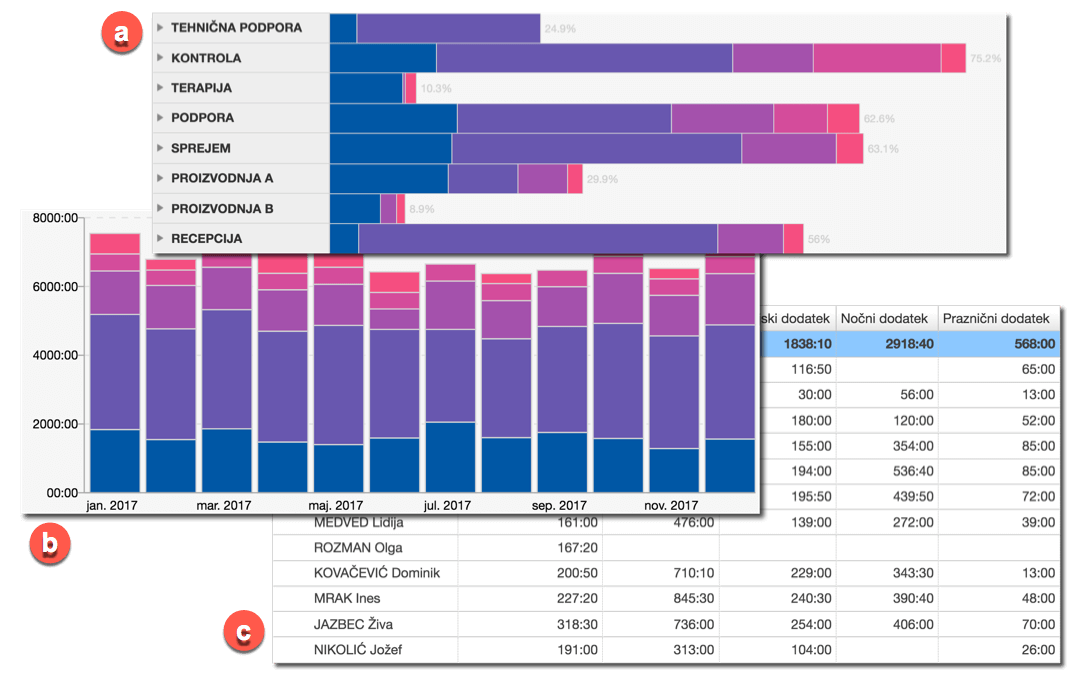
Percentage of different salary supplements shown on a graph: a by department, b monthly for individual department c in a table.